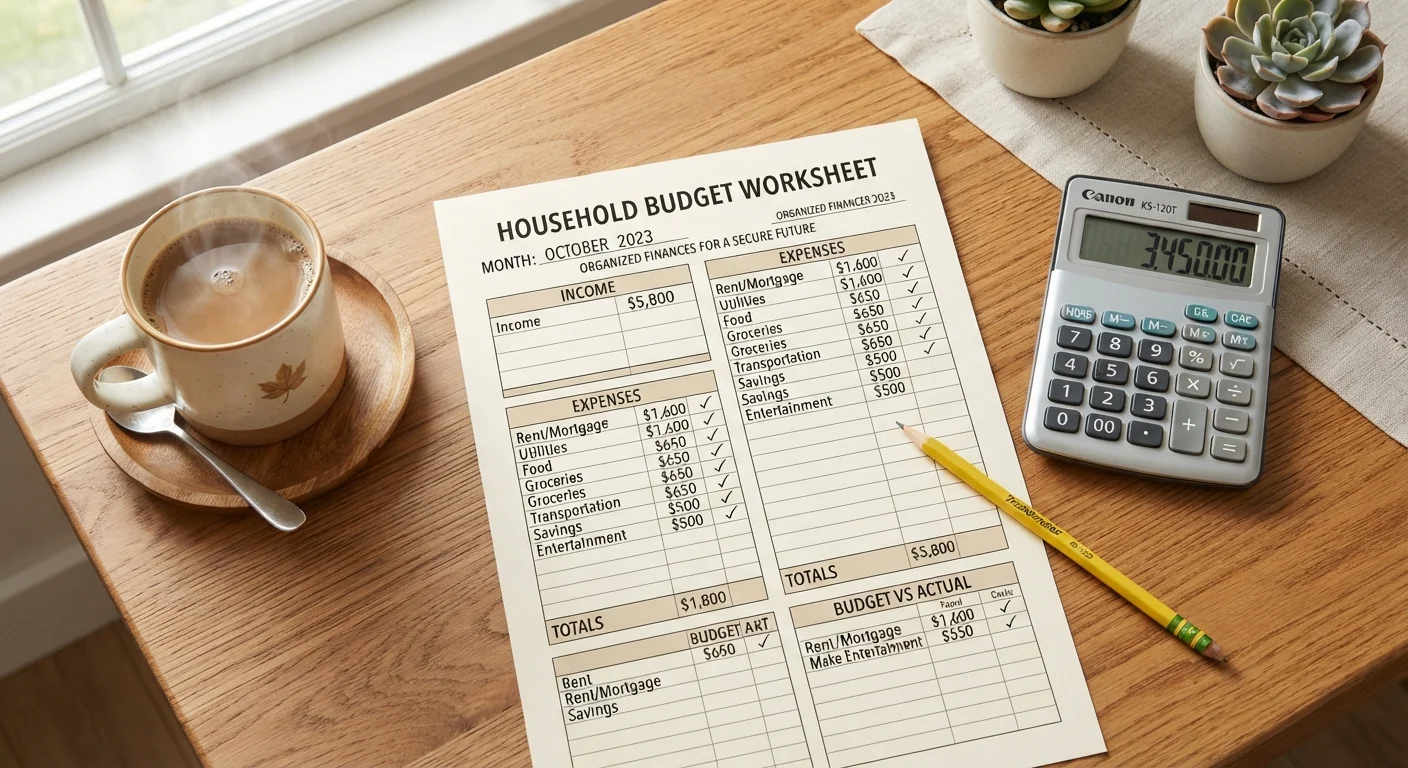
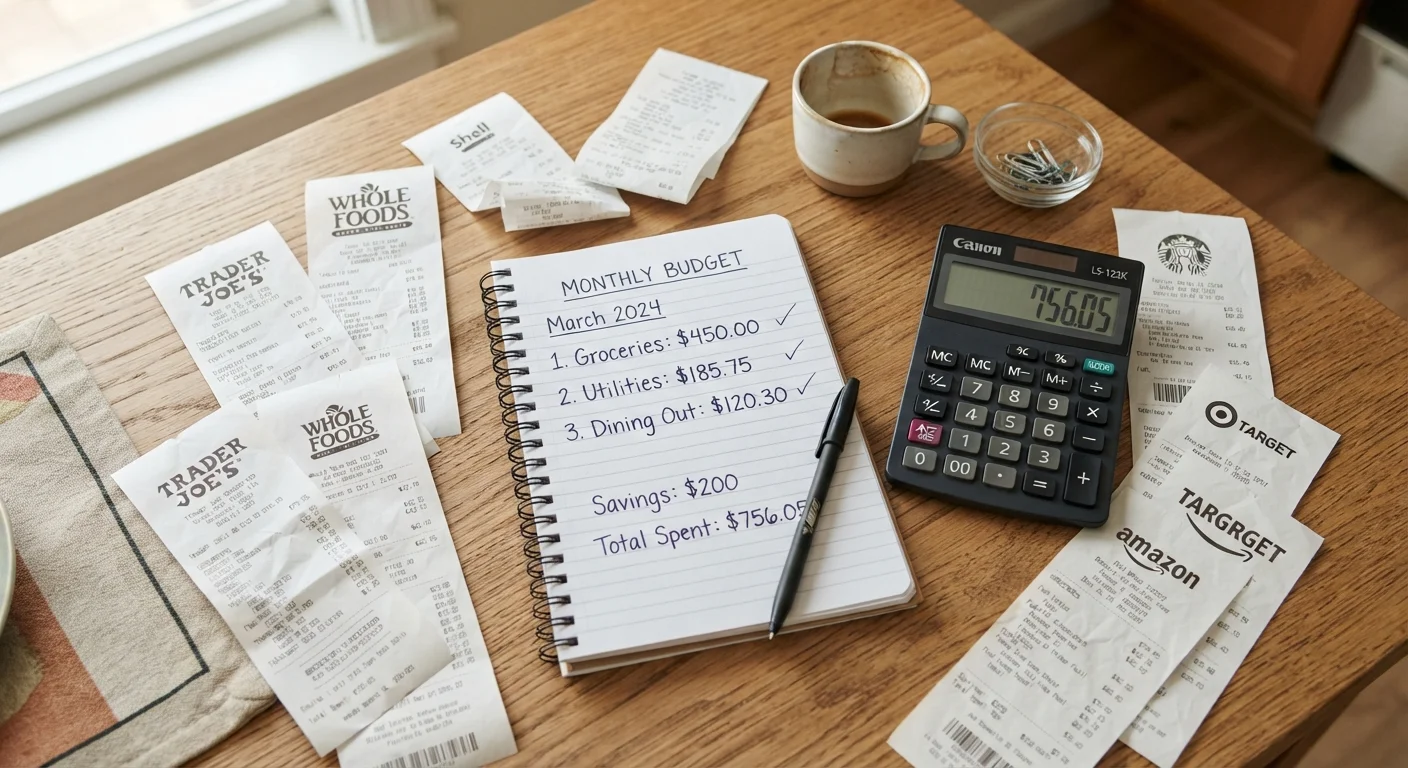
How the Three Categories Break Down
At its core, the 50/30/20 rule asks you to look at your monthly take-home pay and divide it three ways. Here's what each bucket typically includes:
- Needs (50%): Rent or mortgage, utilities, groceries, insurance premiums, minimum loan payments, and basic transportation costs. These are non-negotiable expenses that would disrupt your life if skipped.
- Wants (30%): Dining out, entertainment, gym memberships, travel, clothing beyond basics, and subscription services. These improve quality of life but could be reduced in a pinch.
- Savings & Debt Repayment (20%): Emergency fund contributions, retirement savings, extra payments on high-interest debt, and other financial goals.
The appeal is simplicity. Rather than tracking 30 line items, you monitor three numbers. For households new to budgeting, that low friction matters - many people never start a budget because the process feels overwhelming before it begins.
Apply Percentages to Net, Not Gross Income
A common mistake is calculating the three buckets against gross (pre-tax) pay. The 50/30/20 rule is designed to work with after-tax take-home income. Using gross income will overstate what's actually available to allocate and make the budget appear more manageable than it is.
Where the Rule Holds Up - and Where It Doesn't
The 50/30/20 framework was designed with a middle-income household in mind. For those households, it functions well as a sanity check: if needs are consuming 70% of income, something is structurally off, whether that's housing cost, car payment, or debt load.
However, real American household finances complicate the math in several directions:
The Housing Problem
The U.S. Department of Housing and Urban Development defines housing cost burden as spending more than 30% of gross income on housing alone. In major metro areas - including Los Angeles, New York, Miami, and Seattle - median rent frequently pushes well past that threshold for middle-income renters. When housing alone consumes 35-40% of after-tax income, keeping all needs under 50% becomes a genuine challenge, not just a discipline issue.
Lower-Income Households
For households earning below the national median, the wants category often doesn't exist in practice. Necessities consume a disproportionate share of income, leaving little room for 30% discretionary spending. The framework can feel discouraging rather than useful when it doesn't map to lived reality.
High Earners
On the other end, high earners may find that 30% for wants significantly exceeds what they actually spend - and that the 20% savings target is too conservative given their income level and goals.
The Rule Is a Guide, Not a Guarantee
No single percentage-based framework accounts for the full range of American household circumstances - including student loan loads, medical costs, childcare expenses, or geographic variation in cost of living. Treat the 50/30/20 rule as a starting reference, and adjust allocations based on your actual financial obligations and goals. A licensed financial adviser or nonprofit credit counselor can help you adapt any framework to your specific situation.
These trade-offs don't disqualify the rule - they highlight why it works best as a starting point. For a fuller view of budgeting frameworks that may suit different situations, see other common budgeting approaches worth knowing.
Using the Rule as a Diagnostic, Not a Prescription
The most practical use of the 50/30/20 rule isn't following it exactly - it's using the structure to identify where your money actually goes versus where you'd like it to go.
Start by calculating your real monthly after-tax income, then categorize last month's spending into the three buckets. Most households find one of two patterns: needs are crowding out savings, or wants are quietly expanding without awareness. Either finding is actionable.
30%+
Households spending more than 30% of income on housing
According to the U.S. Census Bureau's American Community Survey, roughly 30% of American homeowners and nearly half of renters are considered cost-burdened by housing expenses.
$6,081
Average monthly household expenditure in the U.S.
The U.S. Bureau of Labor Statistics Consumer Expenditure Survey reports average annual household spending of approximately $72,967, or about $6,081 per month across all categories.
~22%
Share of income Americans save on average
The U.S. personal saving rate fluctuates, but has generally hovered between 5% and 8% in recent years - well below the 20% target the rule recommends, according to the Federal Reserve Bank of St. Louis.
If your needs exceed 50%, the question becomes whether those costs are fixed (long-term lease, existing car payment) or adjustable over time. If wants are oversized, the framework gives you a concrete target to work back from. And if savings are underfunded, you have a clear number to aim for rather than a vague intention to "save more."
For a comprehensive approach to building a budget from scratch - including how to categorize income, set targets, and adjust over time - the complete household budgeting roadmap covers the full process. And if you're weighing whether a stricter structure makes sense, the honest trade-offs of strict budgeting lays out both sides clearly.
This article is for general informational and educational purposes only and does not constitute personalized financial advice. Consider consulting a licensed financial professional for guidance specific to your situation.