The Forces Behind Rising Food Prices
Grocery prices don't rise in a vacuum. By the time a product reaches your cart, it has moved through a chain that includes farmers, processors, packagers, distributors, and retailers - each of whom absorbs and passes along costs. When any link in that chain gets more expensive, the pressure flows forward.
Energy costs are a broad driver. Fuel runs the trucks that move food; natural gas heats the facilities that process it; electricity keeps refrigeration running at every warehouse and store along the way. When energy prices spike, food prices follow, often with a lag of several weeks or months.
Agricultural inputs - seeds, fertilizers, water access, and labor - add another layer. A drought in a key growing region, a disease affecting livestock, or a disruption to a major export corridor can tighten supply and push prices up nationally, even for consumers far removed from the source.
~25%
Cumulative U.S. grocery price increase since 2020
The U.S. Bureau of Labor Statistics Consumer Price Index for food at home showed substantial cumulative increases from 2020 through the mid-2020s, reflecting supply chain disruptions and broader inflationary pressures.
~$270
Average monthly U.S. household food-at-home spend
The U.S. Bureau of Labor Statistics Consumer Expenditure Survey has consistently placed average household food-at-home expenditure in the range of $250-$300 per month, though this varies significantly by household size and region.
1 in 3
Grocery shoppers who report noticing shrinkflation
Consumer surveys conducted by market research organizations in recent years found that roughly a third of shoppers say they've noticed package sizes decrease while prices remained stable or increased.
Labor costs at processing plants and distribution centers have also risen in recent years, reflecting broader workforce market conditions. Those costs are baked into the prices manufacturers charge retailers - and ultimately, what you pay.
Understanding these upstream pressures isn't just academic. It reframes grocery price changes as systemic rather than arbitrary, which matters for how you plan and adjust your food spending over time. For a broader look at how incremental cost increases compound, see how small daily costs accumulate.
Shrinkflation: When the Package Shrinks But the Price Doesn't
One of the least visible ways grocery costs rise is shrinkflation - a term for when a manufacturer reduces the amount of product inside a package while keeping the retail price flat or only slightly lower. The box looks the same on the shelf. The price looks familiar. But you're getting less.
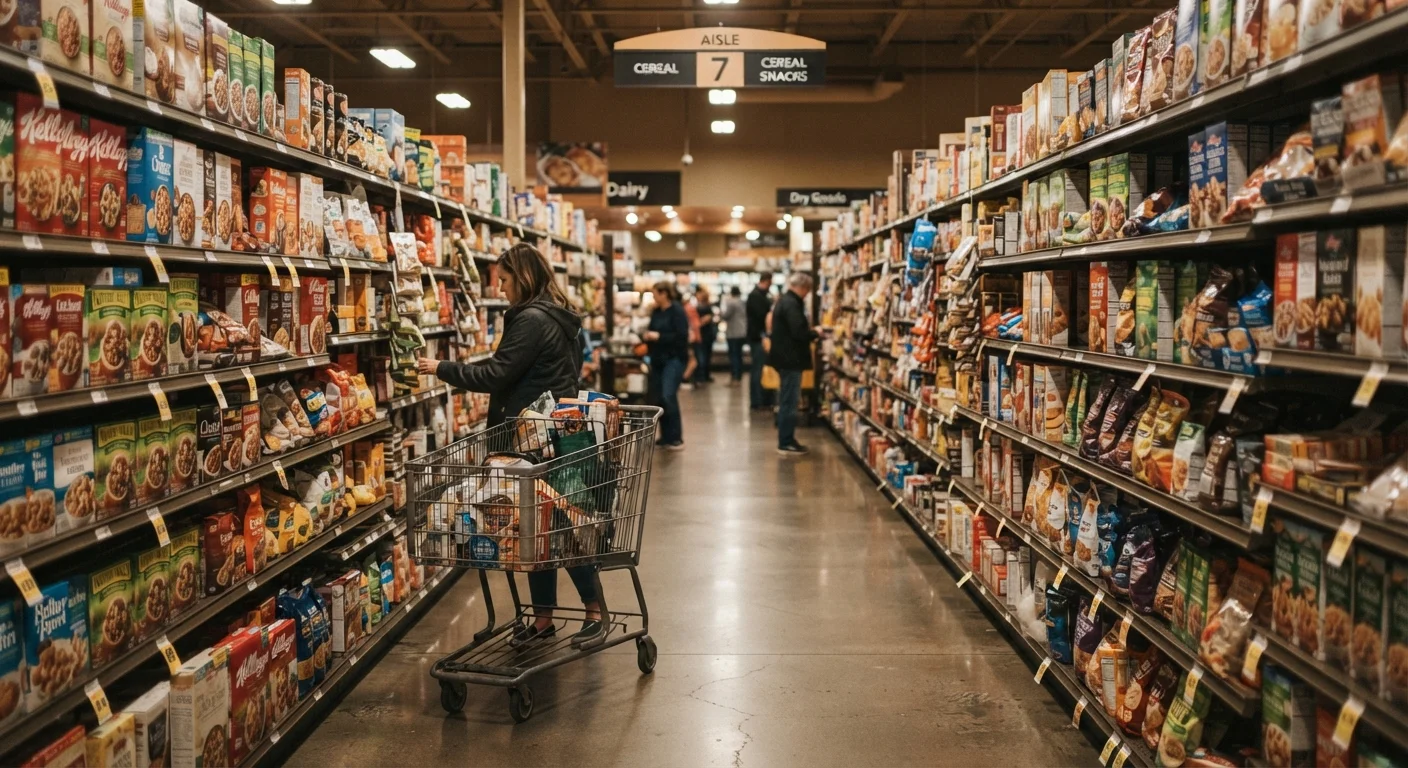
Common examples have included cereal boxes with lower fill weights, chip bags with more air and fewer chips, and rolls of paper towels with fewer sheets per roll. Because the price label doesn't change dramatically, and because most shoppers don't memorize package weights, these changes often go unnoticed for months.
Make Unit Price Your Default Comparison
Before choosing between two similar products, look at the unit price - cost per ounce, per count, or per liter - rather than the total package price. Many stores are required to display this figure on the shelf label. It's the fastest way to catch shrinkflation and identify genuine value differences across sizes and brands.
The practical defense is the unit price label - the small figure on the shelf tag that expresses cost per ounce, per liter, or per count. Comparing unit prices rather than package prices is one of the most effective habits a grocery shopper can build. Our guide on reading price tags more carefully walks through exactly what to look for on those labels.
How Retailers Shape What You Spend
The layout of a grocery store is not designed for your convenience - it's designed to maximize what ends up in your cart. This isn't a cynical observation; it's standard retail strategy, well-documented in consumer behavior research.
High-margin items are typically placed at eye level, where they're grabbed first. Staples like dairy, eggs, and bread are often positioned at the back or perimeter, requiring shoppers to pass through more of the store. End-cap displays (the shelves at the end of each aisle) create a visual impression of a deal even when the item isn't discounted. Checkout lane shelves target impulse additions in the final moments before payment.
“Retail shelf placement is one of the most studied areas of consumer behavior. Where a product sits - at eye level, at the end of an aisle, near the checkout - can meaningfully influence purchase rates independent of price or quality.”
— Consumer behavior research consensus, Widely documented in academic retail and marketing literature
Loyalty programs and store-branded apps can provide genuine savings, but they also generate detailed data on your purchasing patterns. Retailers use that data to tailor promotions that encourage you to maintain or increase spend on the categories you already buy most.
None of this means grocery stores are adversarial. It means that spending awareness - knowing which items you actually need before you walk in - is one of the most effective ways to keep a grocery bill from drifting upward over time. The same deliberate approach applies to other categories; for instance, what drives cost gaps in personal care products follows similar retail dynamics.
Putting It Together: Spending More Deliberately at the Store
Grocery bill creep is real, and it's driven by forces mostly outside any individual shopper's control. But awareness of how those forces work - upstream supply pressures, shrinkflation, and retailer shelf strategy - gives you a clearer framework for the decisions you do control.
A few practical principles follow from what's described above: compare unit prices rather than package prices; treat end-cap and eye-level displays with some skepticism; and distinguish between items on your list and items that appeared in your cart without a plan. None of these require dramatic changes to your routine.
It's also worth recognizing that grocery creep is one piece of a broader household spending picture. Subscription services, for example, accumulate in a similarly gradual way - see how subscription costs add up across a household for a parallel look at that pattern. And online shopping carries its own hidden cost traps; costly habits that drain online shopping budgets covers those in detail.
The Everyday Budgeting hub and the Smart Deal Hunting hub are good starting points if you want to apply these ideas more broadly across your spending.